Range Trading Explained
Learn Forex Trading
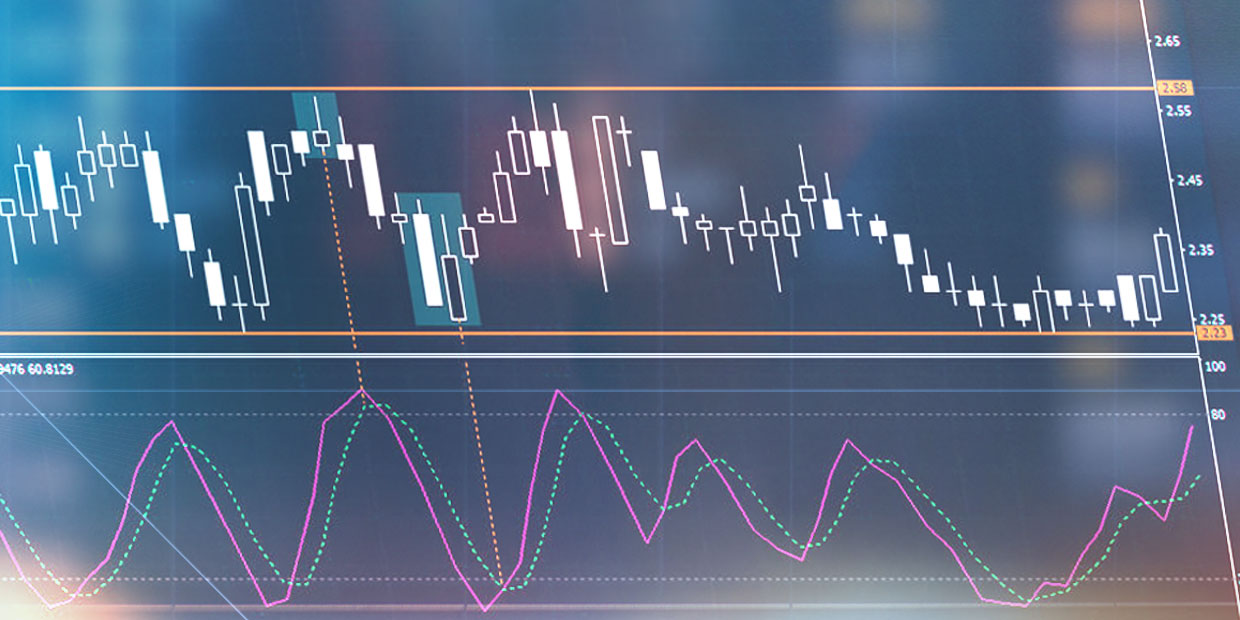
Traders who are just beginning to get a handle on how the markets move, focus on the range pattern; one of the most popular price patterns in technical analysis. In a range, the price bounces from a lower horizontal line (support) and rebounds back down from an upper horizontal line (resistance). This creates a sideways or “trend-less” price movement, which is very appealing even for advanced traders, because when a trader looks at the range in hindsight or on paper, it looks like a very easy way to make money.
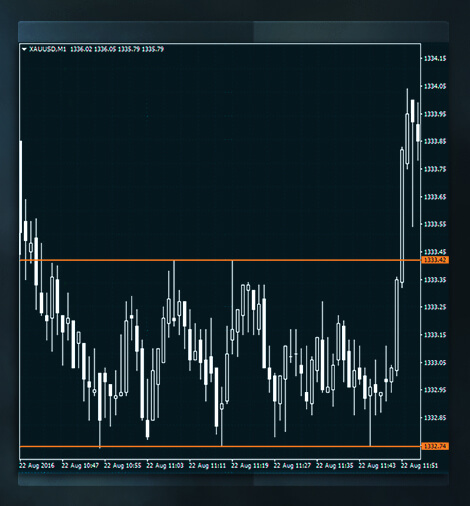
As long as this sideways price movement stays consistent, traders might potentially increase their profits by going long around the support area and short around the resistance area.
An experienced trader knows it’s not enough to trade only when prices reach support and resistance lines, most of the time additional confirmation is needed. In this situation, reversal candlestick patterns can be very effective to help confirm movements, and it’s something advanced traders will pay close attention to.
Here are some examples.
The Hammer
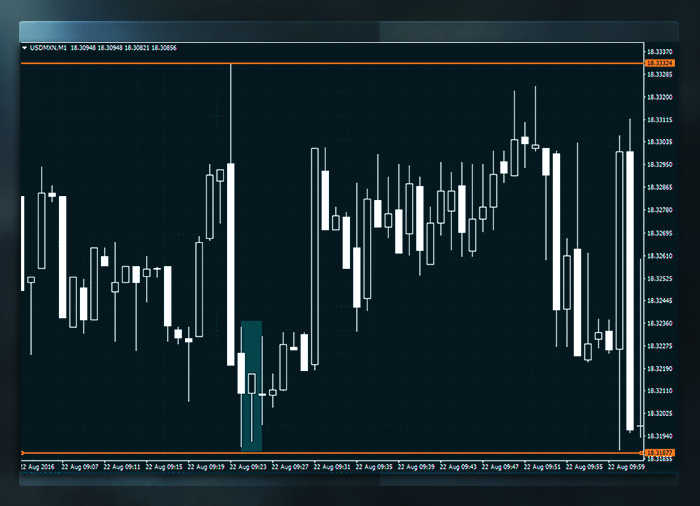
As a very popular bullish reversal candlestick, the hammer consists of a small body in two colours (black or white), and a lower shadow that’s 2-3 times bigger than the body. The upper shadow is tiny or non-existent.
A hammer near the support line will signal a buy alert - a buy signal is triggered once the price exceeds the high of the candlestick. A protective stop-loss can be placed under the support line and similarly, a take profit order can be placed at the resistance level.
The Shooting Star
The shooting star is, in fact, an inverted hammer found near the top of the range by the resistance line. It’s a small body (black or white) with an upper shadow that’s 2-3 times the length of the body and has a lower shadow that’s tiny, or non-existent.
Much like the hammer signals a buy alert, the shooting star signals a sell alert if it’s detected near the resistance.
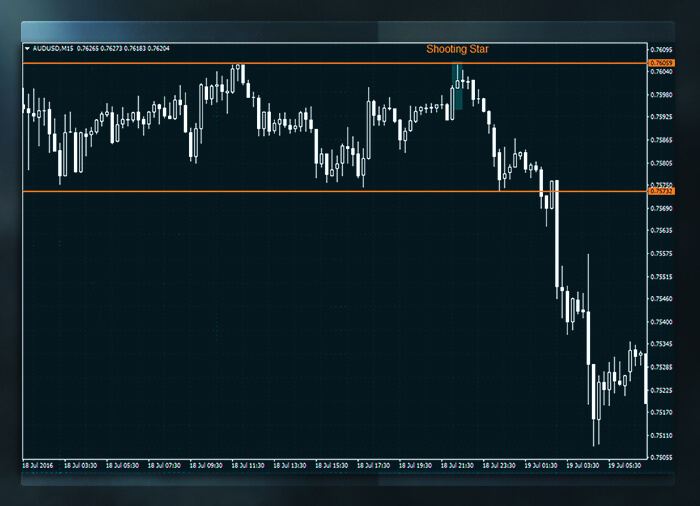
As soon as prices fall below the low of the candlestick, a sell signal is triggered. If the market moves in the opposite direction, a protective stop-loss can be placed above the resistance to protect capital.
The Bullish Harami
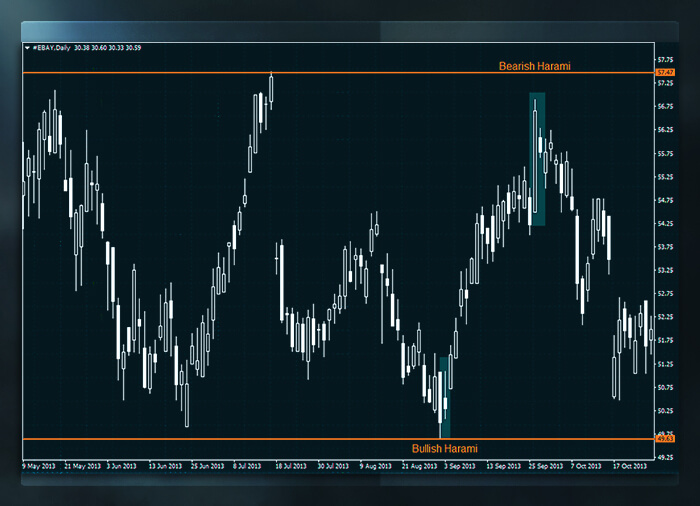
This pattern is made up of a long body of any colour, immediately followed by a small body of any colour. This second body needs to be small enough to be enclosed within the range of the longer, previous, body.
This Harami pattern is bullish if it’s found near the lower part of the range, and if the price exceeds the high of the longer body, a buy signal is triggered. It would be wise to place a stop- loss below the support line, and take profit in the upper side of the range in order to protect your profits.
The Bearish Harami
If this same pattern is found near the resistance line, then it’s called a bearish Harami and signals a sell alert. Similarly, if the price were to fall below the low of the longer body, then a sell signal is triggered.
A protective stop loss can be placed near the upper area of the range, while the take profit levels should be found near the lower end of the range.
Filtered Patterns
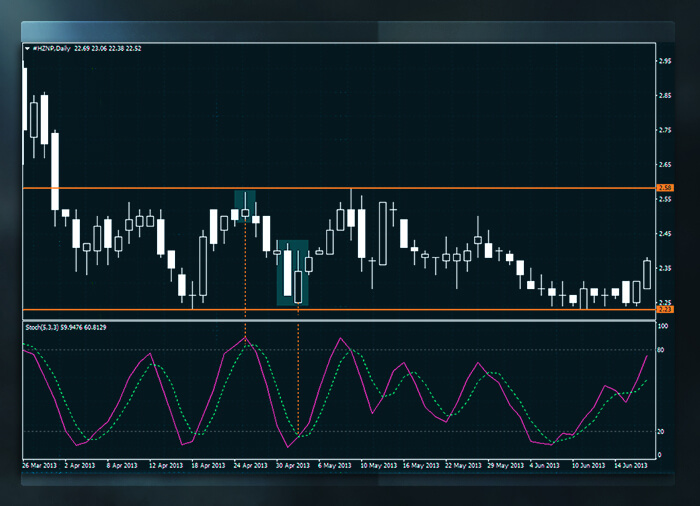
Overbought and oversold extremes can be identified using traditional indicators (Stochastics, for example) in an effort to improve the reliability of the candlestick patterns within a given range.
Stochastics, and other bounded indicators, oscillate between 0 and 100 levels. If it goes below 20, it’s a typical sign of an oversold market and if it’s above 80, it’s a sign that the market is overbought.
Since reversal patterns are considered only when the market is overbought or oversold, these bounded indicators help to improve the pattern’s predictability. For example, if one of the above-mentioned patterns is detected near the upper part of the range and the Stochastic indicator (specifically, %D) is above 80, the pattern becomes a more reliable prediction. Likewise, if a reversal pattern shows up closer to the support line, and the Stochastic indicator (%D) is already below 20, it is also considered a trustworthy signal.
It is important to note that reversal patterns should be ignored if they appear on either end of the two horizontal lines, while the Stochastic indicators are above 20 and below 80, as they are not dependable.
Whether you are a novice or an experienced trader, range trading can be a very useful method of analysis. With that said, even when price action makes a trade look profitable within the upper and lower boundaries of a range, traders should be cautious.
Range trading still maintains a level of risk because price is always unpredictable. It can go beyond the confines of the range at any given time and in any direction.
Using filters, like traditional bounded indicators, can enhance the reliability of reversal patterns in a given range. A common example of this, is combining the reversal candlestick patterns with Oscillators, when the market is overbought or oversold. If they’re not confirmed by the Oscillator, identified reversals should not be taken seriously.
Disclaimer: This written/visual material is comprised of personal opinions and ideas. The content should not be construed as containing any type of investment advice and/or a solicitation for any transactions. It does not imply an obligation to purchase investment services, nor does it guarantee or predict future performance. FXTM, its affiliates, agents, directors, officers or employees do not guarantee the accuracy, validity, timeliness or completeness of any information or data made available and assume no liability for any loss arising from any investment based on the same.
Risk Warning: There is a high level of risk involved with trading leveraged products such as forex and CFDs. You should not risk more than you can afford to lose, it is possible that you may lose more than your initial investment. You should not trade unless you fully understand the true extent of your exposure to the risk of loss. When trading, you must always take into consideration your level of experience. If the risks involved seem unclear to you, please seek independent financial advice.
