Gann Swing Charts

Learn Forex Trading
One of the core principles of technical analysis is that prices move in trends. Subsequently, the goal of technical analysts is to identify the trend in its very early stages of development. While experienced traders may nod their head in agreement, often beginners face difficulties identifying the trend on the price chart. Lack of experience and practice is to blame, of course. Trend is identified once the turning points of the market are spotted. The technique of spotting the tops and the bottoms on the chart is not clear to everyone and the procedure can become an unpleasant process of trial and error for newbies.
This article intends to shed some light into just that.
W.D. Gann
William Delbert Gann is considered by some to be one of the greatest traders of stocks and commodities of all time. He correctly forecasted that the 1909 September wheat price would reach $1.20, Black Friday of 1929 and the 1930s Great Depression, just to name a few of his calls.
Gann was fond of mathematics and as a result he spent many years studying the subject in England, India and Egypt. He believed that the markets follow the laws of mathematics and that there is a relationship between price and time. He later formulated his theory into what is known as the squaring of price and time. Even though he went on to develop many complicated concepts and theories, the Gann Swing Charts remains perhaps one of the easiest to understand.
Gann Swing Charts
The main goal of using Gann’s charts is to remove the “noise” from the price charts, which is not only unnecessary but also obscures the interpretation of the price action. Gann put in place an objective, a mechanical procedure – free from emotions and subjectivity – to identify the swings on the price chart.
Four Basic Elements of Gann Swing Charts
Up Day – Higher High, Higher Low

Down Day – Lower High, Lower Low

Inside Day – Lower High, Higher Low

Outside Day – Higher High, Lower Low

Construction of Gann Swing Charts
The rules for constructing Gann Swing Charts are as follows:
- Identify the turning points on the price chart.
- A series of Up Days followed by a Down Day marks the end of the uptrend and the beginning of a new trend in the opposite direction: downtrend.
- A series of Down Days followed by an Up Day marks the end of the downtrend and the beginning of a new trend in the opposite direction: uptrend.
- Ignore Inside Days as they are neutral.
- Outside Days are treated as “wait and see”.
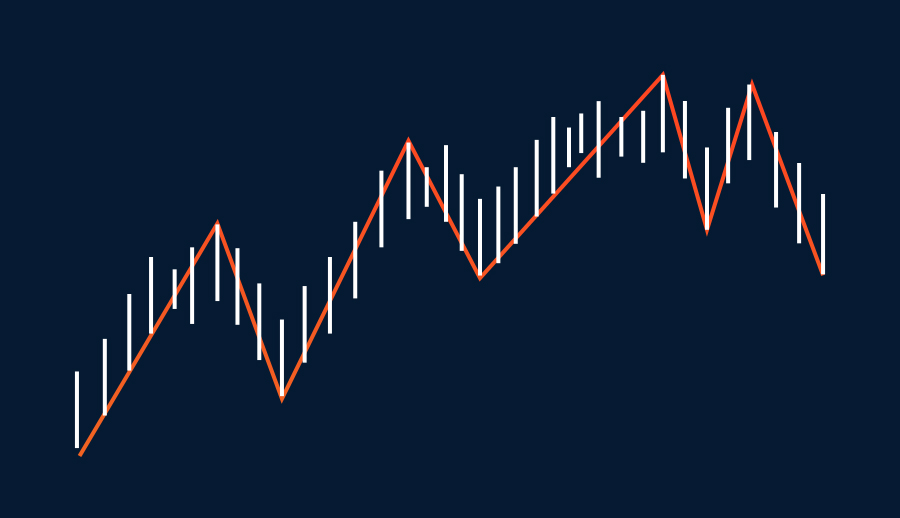
Up Day – Green
Turning Point
Down Day – Red
Inside Day – Black
Outside Day - Blue
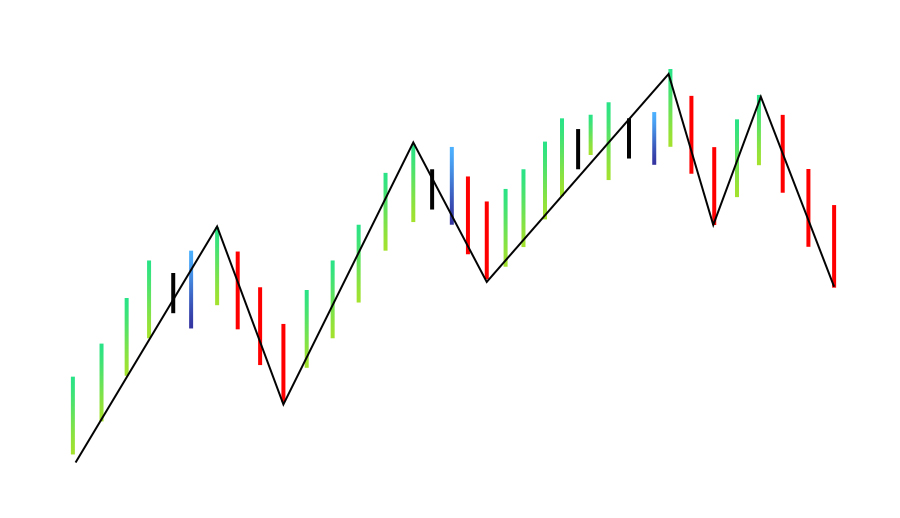
Time Factor
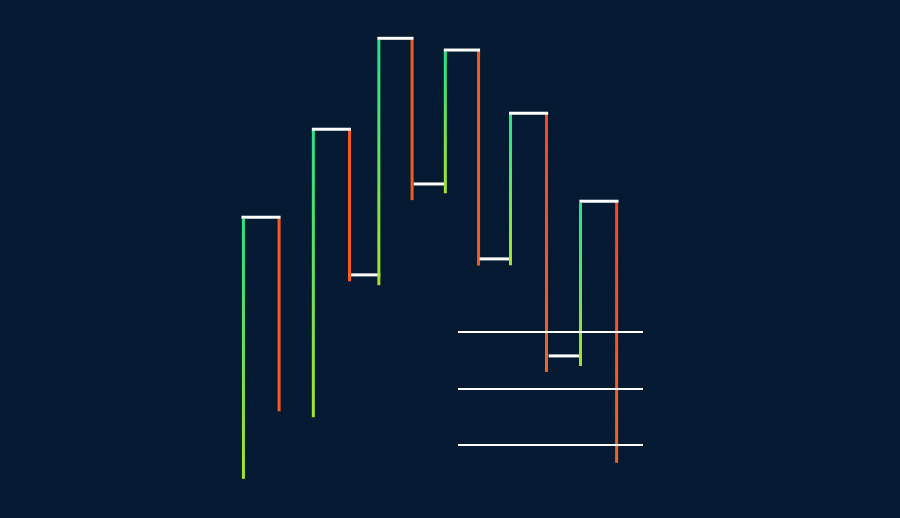
The next step is to remove the time factor by deleting all the candlesticks/bars that are not turning points. After all, what we are really interested in is the direction of the market.
Turning Point
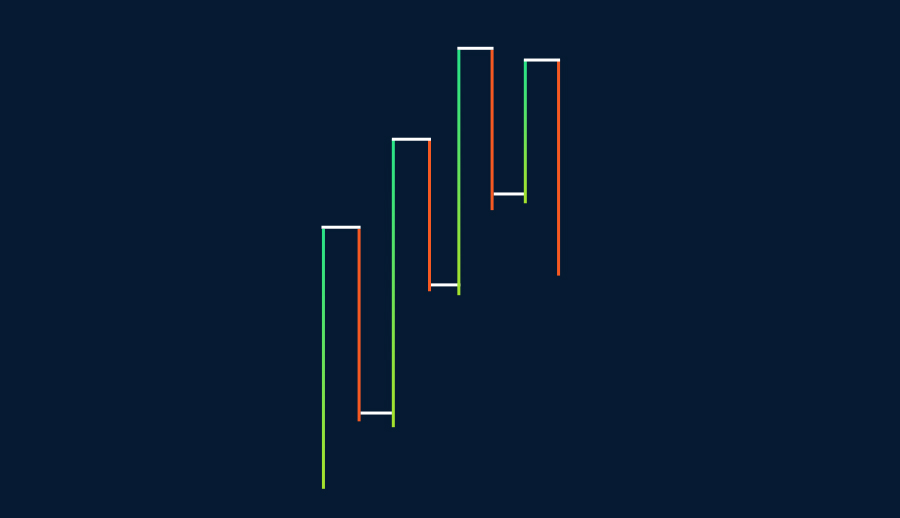
Trading the Swing Charts
Many find trading the Gann Swing Charts easier as the entry and the stop loss are clearly identified on the price chart. The potential profit levels can be spotted using different theories. You can use the Fibonacci price extension levels (for example, 1.618, 2.618 and 4.236), altering the Fibonacci levels according to your trading profile.
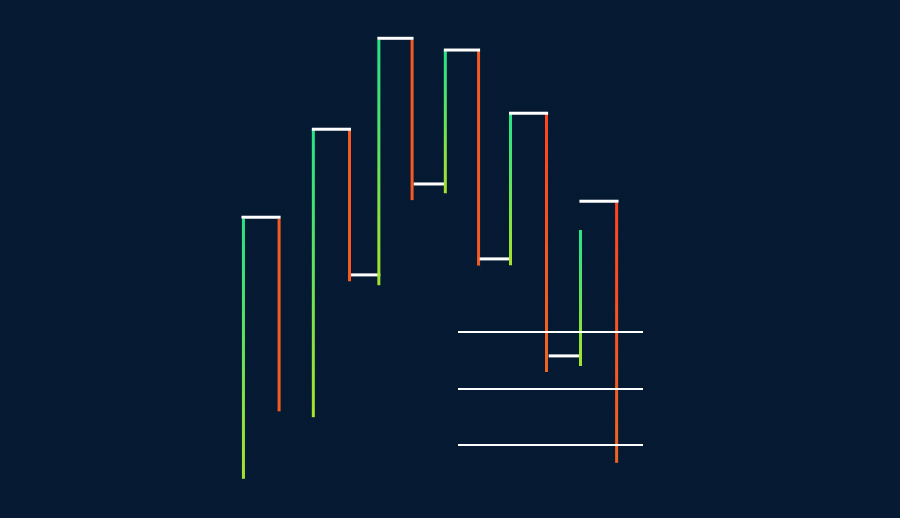
Additionally, one may choose to keep a trade open, trailing the stop loss at subsequent swings until a swing in the opposite direction is identified. This is common practice in trading the financial markets. Caution should be taken; while the trailing stop may safeguard potential profits, at the same time it may prematurely exit a profitable trade.
On the other hand, keeping a fixed stop loss expecting a swing in the opposite direction to book potential profits may result in more profits, but equally it might turn a winning trade into a losing one. The choice is yours!
Conclusion
Gann Swing Charts remove unnecessary price action, displaying only the important turning points that make decision-making a more objective and straightforward process. This not only makes chart analysis easier, but it also “preserves” one of the most important factors in trading the financial markets: discipline.
Learn to trade with FXTM
Discover how to make the right trading decisions for your style and goals with our comprehensive range of educational resources. Learn from home when and how it suits you with our educational videos or sign up for a remote webinar. We also host on-location, interactive forex seminars and workshops around the world – there might be one coming to your area soon!
Disclaimer: This written/visual material is comprised of personal opinions and ideas. The content should not be construed as containing any type of investment advice and/or a solicitation for any transactions. It does not imply an obligation to purchase investment services, nor does it guarantee or predict future performance. FXTM, its affiliates, agents, directors, officers or employees do not guarantee the accuracy, validity, timeliness or completeness of any information or data made available and assume no liability for any loss arising from any investment based on the same.
Risk Warning: There is a high level of risk involved with trading leveraged products such as forex and CFDs. You should not risk more than you can afford to lose, it is possible that you may lose more than your initial investment. You should not trade unless you fully understand the true extent of your exposure to the risk of loss. When trading, you must always take into consideration your level of experience. If the risks involved seem unclear to you, please seek independent financial advice.
