Identifying Trends: A Beginners’ Guide
Learn Forex Trading
In the early stages of trading, the identification of a trend emerges as a compass to the markets. We have all heard the phrases “the trend is your friend”, “never go against the trend” and “trade with the trend”. But, what is a trend and why is it so important? A trend is simply the prevailing direction of the market. It is the direction that future prices will most likely follow. So, the early identification of the trend is imperative in trading the financial markets. Whether it’s going up, down or sideways, has to be determined before entering the market. Many trading systems have been developed with precise rules on when to open a trading position, exit a losing trade and of course lock potential profits. Trend identification is one of the cornerstones of successful trading
Tops and Bottoms
A common way of detecting a trend is by visual inspection. Spotting consecutive higher tops and higher bottoms will indicate an uptrend, while consecutive lower tops and lower bottoms will indicate a downtrend. Equal tops and equal bottoms will define a sideways, trendless market. Even though identification of tops and bottoms looks very easy in hindsight, traders, especially beginners, sometimes find it difficult to find prevailing trends, it does take some practice. Another common way of identifying a trend on the price chart, is by attaching technical tools designed to spot the direction of the market. Indicators and oscillators fall in this category which are based on statistical concepts like inductive statistics.
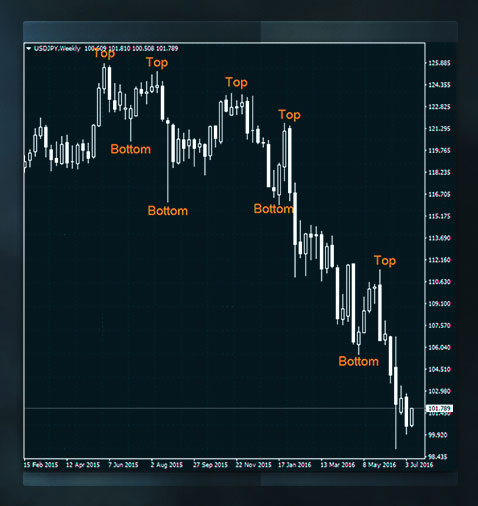
Using trading tools like indicators and oscillators, is a popular way for identifying a prevailing trend. There are many such tools, which may confuse traders who are just getting acquainted with them, so we will focus on the three most popular trend-identifying indicators.
Moving Average
A very popular tool for traders is the Moving Average. It is an indicator that focuses on a series of averages. It is a very simple tool; when prices cross above the Moving Average curving line, an uptrend is expected. When prices pass below the Moving Average line, a downtrend is usually formed because there are more sellers than buyers influencing the price.
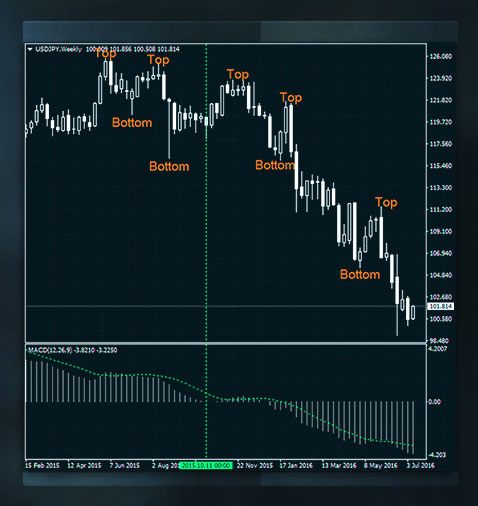
MACD
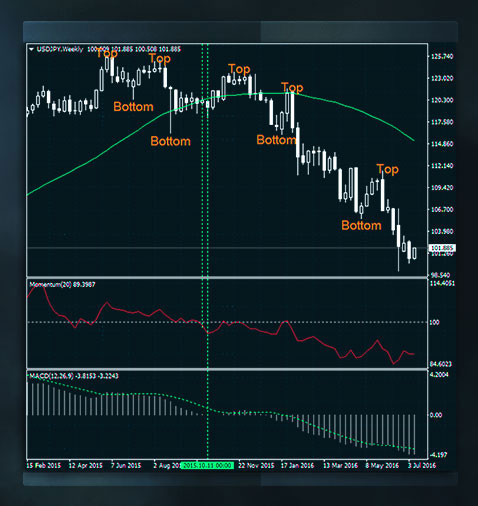
A Moving Average Convergence Divergence indicator, or MACD for short, shows the difference between two exponential moving averages (i.e. MA’s that place special emphasis on the most recent prices). Once the equilibrium line (the zero) is crossed, the start of a new trend is signaled - just like with any other oscillator. A positive MACD reading implies an uptrend while a negative MACD reading signifies that prices have been falling- the typical feature of a downtrend.
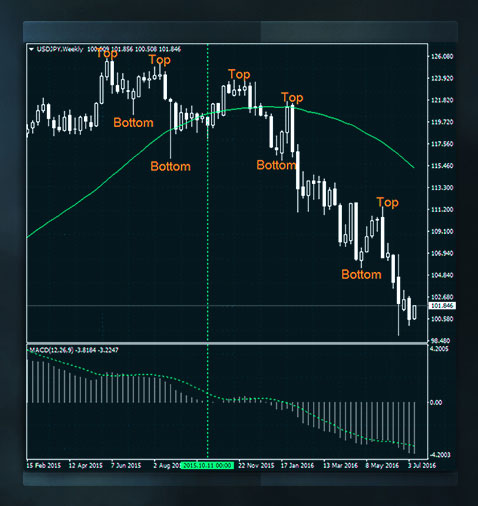
Momentum
This indicator measures the rate at which prices change. In other words, how quickly the price increases or decreases. In the case of Momentum, the equilibrium line is at 100. A new uptrend begins when prices are seen to accelerate and the oscillator crosses over the equilibrium line – this would be a positive signal. The opposite is true when prices decelerate and Momentum passes below the equilibrium. In that case, it’s a negative signal that shows a downtrend.
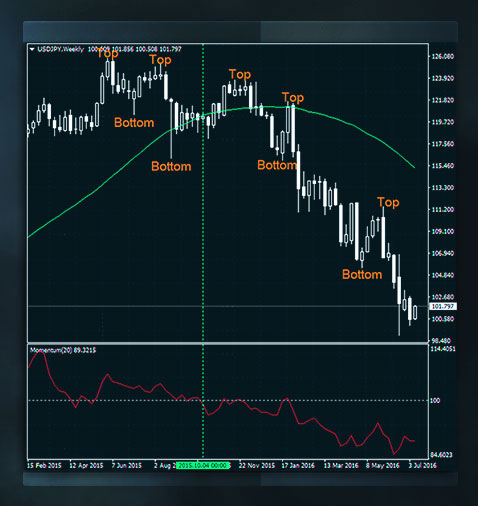
Validation
The confluence of all three indicators (i.e. Moving Average, MACD and Momentum) in the same direction, increases the probability of the market moving in the predefined direction. As a result, when all three indicators signal the same trend, traders tend to be more confident with their analysis which in turn, makes their trading more disciplined.
 Disclaimer: The content in this article comprises personal opinions and ideas and should not be construed as containing personal and/or other investment advice and/or an offer of and/or solicitation for any transactions in financial instruments and/or a guarantee and/or prediction of future performance. FXTM, its affiliates, agents, directors, officers or employees do not guarantee the accuracy, validity, timeliness or completeness of any information or data made available and assume no liability as to any loss arising from any investment based on the same.
 Risk Warning: There is a high level of risk involved with trading leveraged products such as forex and CFDs. You should not risk more than you can afford to lose, it is possible that you may lose more than your initial investment. You should not trade unless you fully understand the true extent of your exposure to the risk of loss. When trading, you must always take into consideration your level of experience. If the risks involved seem unclear to you, please seek independent financial advice.
Disclaimer: This written/visual material is comprised of personal opinions and ideas. The content should not be construed as containing any type of investment advice and/or a solicitation for any transactions. It does not imply an obligation to purchase investment services, nor does it guarantee or predict future performance. FXTM, its affiliates, agents, directors, officers or employees do not guarantee the accuracy, validity, timeliness or completeness of any information or data made available and assume no liability for any loss arising from any investment based on the same.
Risk Warning: There is a high level of risk involved with trading leveraged products such as forex and CFDs. You should not risk more than you can afford to lose, it is possible that you may lose more than your initial investment. You should not trade unless you fully understand the true extent of your exposure to the risk of loss. When trading, you must always take into consideration your level of experience. If the risks involved seem unclear to you, please seek independent financial advice.
